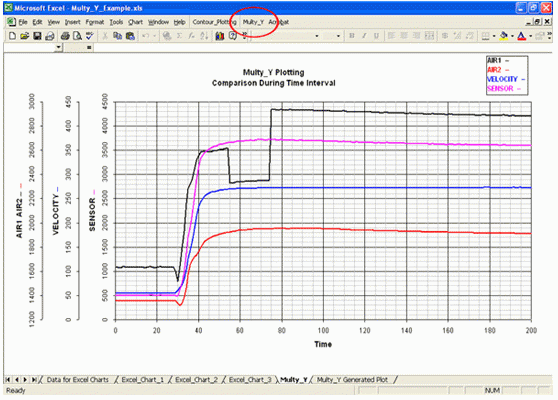
Multiple Y axes plots are created from existing Excel Charts. Each Excel chart appears as a new Y axis on the Multy_Y plot. The plot is a picture that appears on a separate Excel Chart. Creates 2, 3, 4... Y axes.
Download
System Requirements:
Win2000, Win7 x32, Win7 x64, WinServer, WinVista, WinVista x64, WinXP
Version:
1.01
Last updated:
2011-05-05 06:43:12
Publisher:
Office Expander
Homepage:
http://www.OfficeExpander.comFile name:
Multy_Y_Install_Demo.exe
File size:
0.55MB
License:
Shareware
Price:
69.99